
The ROI of content marketing is notoriously difficult to measure because the customer journey is usually very complex.
Even if a customer visited a blog post, how important was that interaction to the conversion?
Yet a fundamental content marketing skill that separates good from great content marketers is the ability to identify and double down the most effective strategies.
There isn’t a single best method to track the value of your content efforts, though depending on your business and your goals, here are some important content marketing metrics to track.
Want us to
scale your traffic?
For the first time, The Copyblogger methodology is now available to a select few clients. We know it works. We’ve been doing it since 2006.
1. Conversions/Demo Signups
Content marketing is designed to ultimately drive sales, so conversions and demo signups are arguably the most important metrics to measure.
To start tracking conversions and demo signups, set up Google Analytics, and then watch this tutorial on how to track conversions in the dashboard. There are some other analytics tools, though Google Analytics is free and still seems to be the default tool for most companies.
Once you set up your analytics, you can see which blog posts and pages on your website contributed to conversions and demo signups.
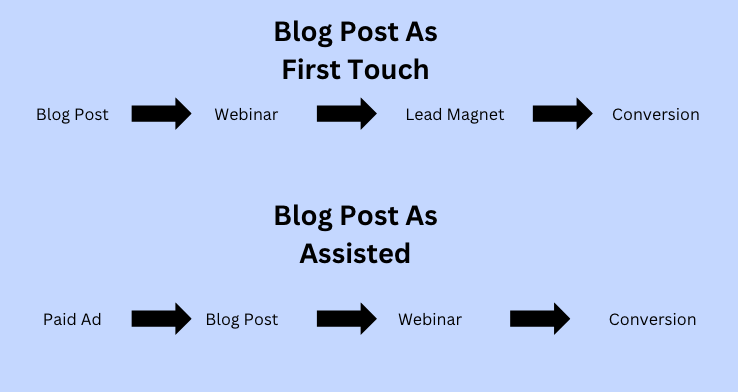
Ideally, you want to track first-touch conversions, as this metric will show you which people originally found your brand through the blog and later converted into customers.
Assisted conversions are also helpful as this metric shows which blog posts the user visited before making a purchase.
2. Email Signups/Lead Magnet Downloads
Tracking demo leads and product signups is ideal, though because the customer journey is so complex, it’s not always entirely accurate – especially if you’re selling an enterprise product with a long customer journey.
While it’s still a good idea to try tracking the entire customer journey from start to finish, you can also track email signups and lead magnet downloads from each piece of content. This will help you understand if your content effectively moves the customer to the next step in the customer journey.
If you notice that people are visiting your content but not downloading the lead magnet or signing up for your email list, it means that either the content is bringing irrelevant traffic or the lead magnet isn’t a good match for that audience.
Either way, it will illuminate where the gaps in your sales funnel exist so that you can fix them.
3. Keyword Rankings
Most content marketers track all their keywords (or as many as they can). Yet not all keywords are equally impactful to your business goals. Specifically, bottom-of-the-funnel, high purchase intent keywords tend to drive the most new leads, so prioritize moving even just a few spots higher in the search results for these keywords.
You can either manually track these keywords in Google Search Console or use a tool like Ahrefs or SEMrush to track these rankings.
For example, inside Ahrefs, you can go to the Rank Tracker tool and then type in the keywords you want to track:
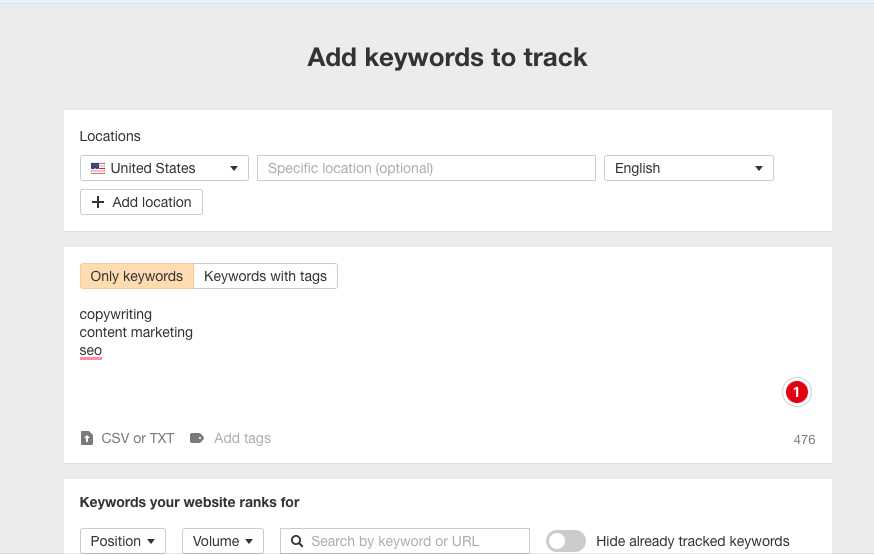
It automatically connects with Google Search Console, so you can instantly pull in all of your keyword data.
4. On-Page Engagement Rates
There are many user engagement metrics, so we’ll break them down into a few critical categories.
Average Time on Page
Time on page signals the quality and relevancy of your content. If visitors quickly leave your page, it’s likely because the content was unsatisfactory, whereas if they stick around and click through the rest of your website, they probably find it a helpful resource.
As the end goal of search engines is to deliver the best user experience possible, it’s no surprise that average time on page is likely a factor they consider when determining rankings in the search engine results pages (SERPs).
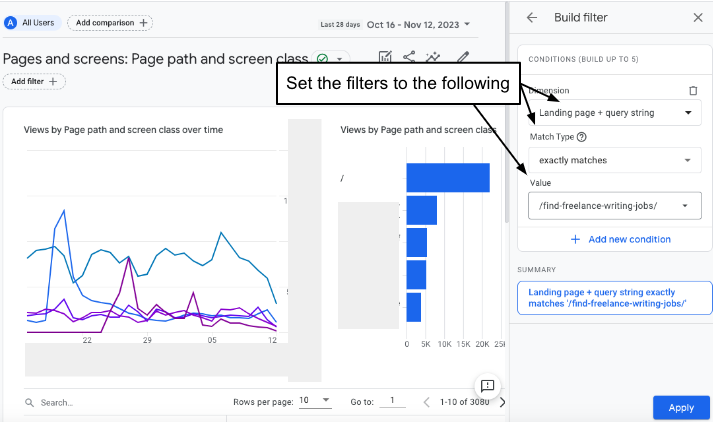
You can find your average time on page score inside Google Analytics. Inside the dashboard, click on Engagement > User and Screens.
Then, click “Add A Filter,” and you can set the filter to the following settings:
Scrolls/clicks
Users scrolling, clicking, and interacting with your content is a good sign that it is helpful and engaging.
To increase your time on page, use a heatmap tool like Hotjar to track which parts of the page people spend the most time reading and identify where on the page most visitors reach before they leave.
With this information, you can optimize that section of your content to reduce bounce rates and improve time on page.

You can also track how many people click on your call to action (CTA) buttons and general user behavior on your site.
Comments
Comments give you more detailed insight into who is visiting your blog (if they are your ideal customers), and many of them will provide direct feedback on the quality of the content and additional questions they still have.
For example, this comment shows both who is visiting the blog (a newbie that just launched a website) and her opinion on the post:
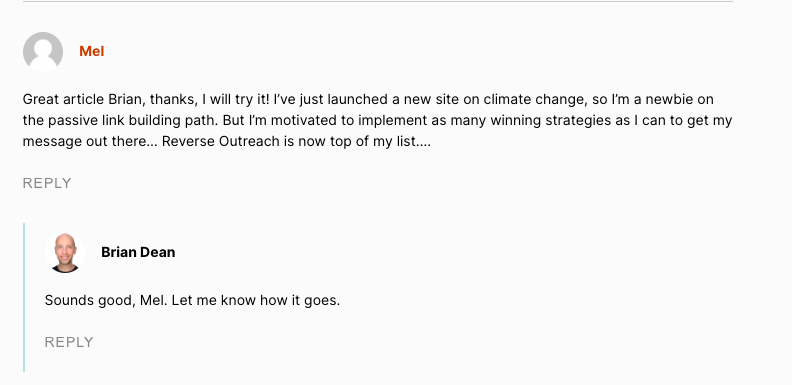
This information is very useful for the content marketing team, as you can tell whether you’re attracting your ideal target audience and if that audience believes what you have to offer is useful.
According to Marie Haynes, user generated content may help boost your content’s rankings in Google, so having high quality discussions with users in the comments section of your blog may also improve your SEO presence.
If the website and blog generally have low engagement rates, talk to your sales and customer success teams to understand the pain points your customers experience before purchasing your product and service, and then audit your content strategy based on that data.
5. Organic Traffic
Organic search traffic is usually one of the first key performance indicators (KPIs) most content marketers prioritize.
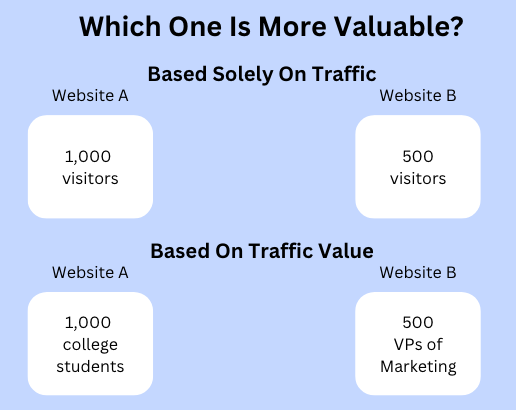
However, it can also be very deceptive as not all website traffic is equally valuable. For example, if you’re selling an email marketing software, a visit from a VP of marketing actively looking to purchase a new email marketing software is much more valuable than a college student browsing different email marketing platforms for a project they’re working on for their marketing class.
Yet if organic traffic is the key metric you’re using to measure content performance, a website generating 1,000 visits from college students who will never buy the software is more valuable than a website generating 500 visits from VPs of Marketing actively looking to purchase email marketing software.
Instead of exclusively measuring organic traffic across your website, measure organic traffic for only relevant keywords that attract high quality visitors.
What are relevant keywords?
The most important keywords are both:
- From your ideal audience: A college student will never buy your marketing software, but a VP of marketing might make a purchase at some point in their career.
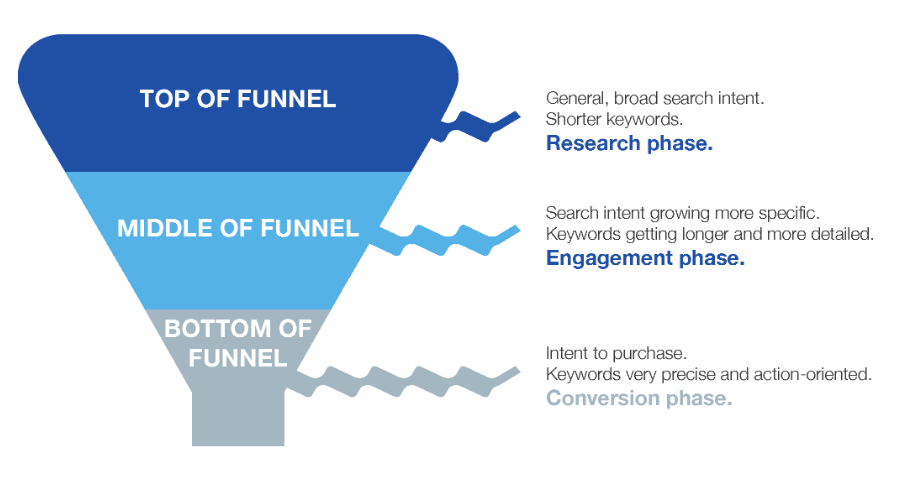
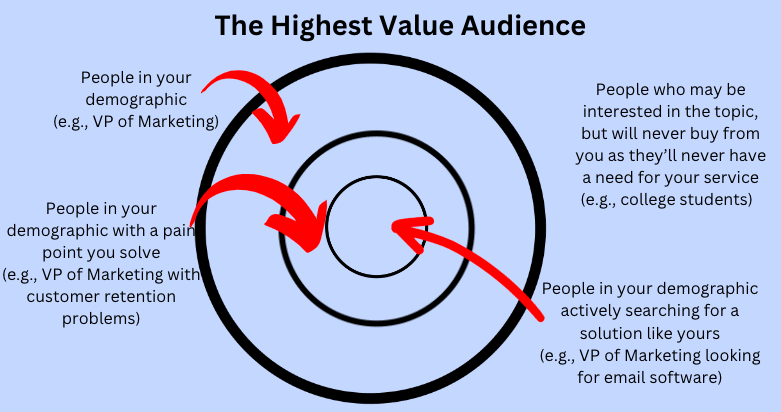
- At the end of the buyer journey: A VP of marketing actively comparing different email marketing software is often a better visitor to target than a VP of marketing at the beginning of the buyer journey, who may simply be exploring different ways to improve their user retention metrics.
You’ll also notice that there are far fewer people at the end of the buyer journey than there are people at the top of the buyer journey. This is normal as people at the top of the buyer journey may ultimately decide to solve the problem manually or use a completely different approach to solve the issue.
Therefore, keywords at the top of the funnel often have more search volume and drive more traffic than keywords at the bottom of the funnel.
This means that search volume for a keyword is often inversely correlated with conversion rate.
As you’ll see in the graphic below, the smallest circle in the middle is really the highest value audience, because they are ready to buy a product like the one you offer:
This is a key reason why traffic is often a vanity metric, and only reporting on generic traffic is not a great metric to measure the success of your content marketing program.
To summarize: Measure the organic traffic of your most important keywords, but don’t use organic traffic as a standalone metric to measure content marketing ROI.
6. Backlinks And Shares
Backlinks are a great way to measure your content marketing success as they are critical to increasing your website’s general authority, which can increase rankings in the search results pages.
As you measure backlinks, look at these three metrics:
- Volume: How many backlinks your content attracts.
- Quality: The domain authority and general relevancy of the linking website.
- Relevancy: Is the linking websites in the same industry or niche you’re targeting?
It’s also ideal to earn backlinks from different websites rather than multiple links from a single website, as search engines want to see that multiple sites recommend you as a credible source.
You can check your backlinks and backlink growth in a tool like Ahrefs or SEMrush.
Inside Ahrefs, you can track your top content by links, and there are plenty of filters to sort by only do-follow links (which are significantly more powerful than no-follow links) and recency:
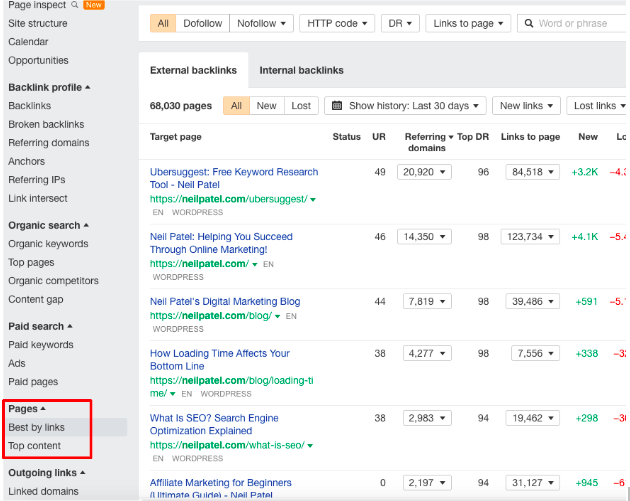
This report also shows you the anchor text of the link. This information is helpful as it shows why people linked to your content (e.g., is there a particular statistic or quote they chose to reference?). Once you figure out why people linked to your content, you can create more similar content to earn more backlinks.
If you’re stuck and can’t think of any great content marketing ideas, we have a guide on generating better content ideas as well as various content marketing examples you can use to earn more backlinks.
Another positive sign that users like your content and find it insightful is if they are consistently sharing it on social media. You can also look at who is sharing your content to gauge if you’re earning traffic from your ideal target audience. Spend some time reading through the social shares, too, as this can give you qualitative feedback on your content.
Here’s a great example of this:

You can track social shares by using a social listening tool like Awario or Brand24, which lets you track your branded keywords (and even your competitors’ branded keywords).
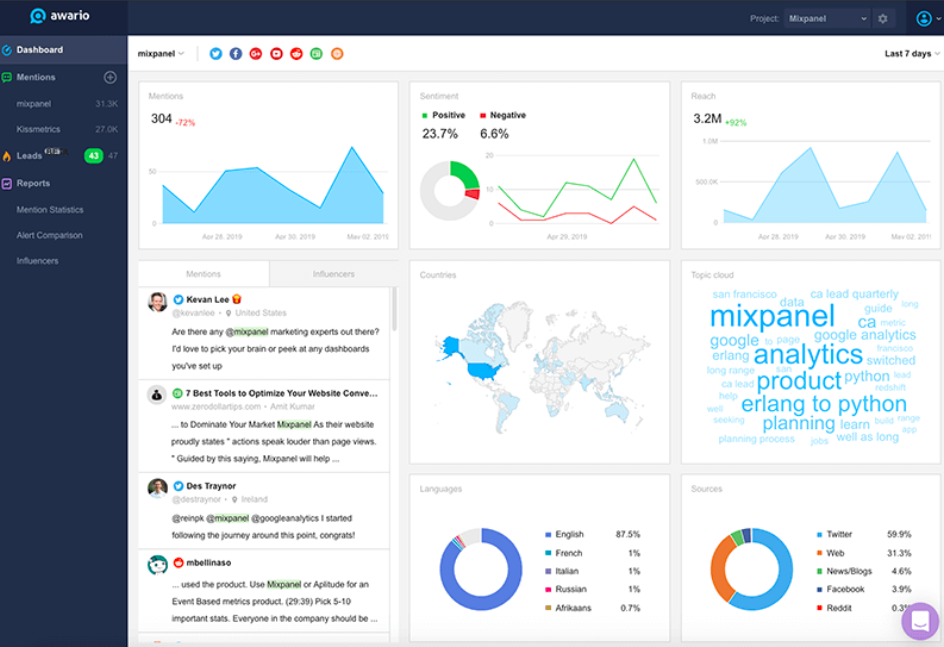
Social media monitoring tools also make it easy to track brand awareness, which is another great way to gauge the success of your content marketing campaigns.
7. Visitor Surveys
One of the best ways to measure content quality and evaluate if it’s effectively answering the searcher’s questions is to simply ask your readers for their opinion.
Hotjar offers a service that allows you to add a pop-up icon in the bottom corner of your website that surveys users on the effectiveness of your content.
Here’s an example of what it might look like:
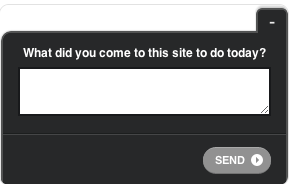
Limit your survey to just one or two questions to increase response rates. Also, offering a multiple choice survey will increase response rates, but the qualitative data you collect in the open ended questions may be much better. So consider testing both forms and judge both the response quality and volume.
8. Share of Voice
Ideally, you want to see that your brand generally earns more and more of the real estate in search engine results for keywords most important to your business.
For example, if you sell email marketing software, you’d want your brand to appear everywhere for keywords related to email marketing.
You can track share of voice in a third party tool like Ahrefs or SEMrush.
For example, if you’re using Ahrefs, you can click on “Rank Tracker” and then click on “Overview” under the Competitors heading.
You can enter a list of your competitors’ URLs, and the tool will give you an overview of how much traffic each competitor has for the keywords you’re tracking:
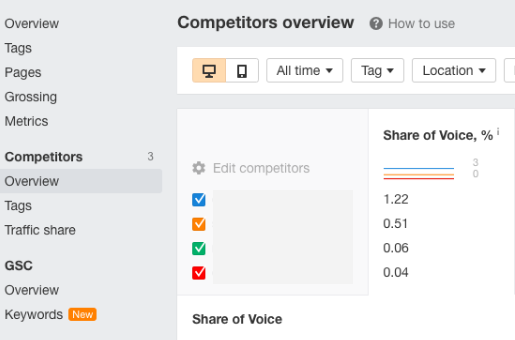
This makes it easy to track your brand’s share of voice over time.
9. Audience And Behavior Metrics
There are plenty of different metrics you can track, but the following metrics are excellent to better understand who is coming to your website and how they are interacting with your content:
- Page Views: This is how many pages someone visited on your website. If they visited multiple pages, that’s a good sign that they liked the content and proceeded through the buyer funnel.
- Click Through Rates (CTRs): While technically not an on-page metric, your click-through rate demonstrates how effectively your title tags and meta descriptions encourage users to visit your site. You can have the highest quality content in the world, but it won’t matter if people don’t click to visit your site.
- Bounce Rates: This is the percentage of users who enter your website and then return back to the search results without clicking further into your website. A high bounce rate therefore indicates that users didn’t feel inspired to browse further in your site and is a negative user signal. Ideally, you want visitors to stick around and explore more of your website.
- Number of Pages Visited: This metric is similar to bounce rate. Ideally, track specific pages that users visit on your website so that you can monitor how they move through the sales funnel.
- New vs. Returning Visitors: A higher visitor return rate means you’re effectively generating and capturing traffic rather than just randomly attracting new visitors. So a high rate of returning visitors is a good sign!
You can find all of these metrics in Google Analytics.
Track Critical Content Metrics Now
Tracking the ROI of your content marketing efforts can be daunting, and optimizing for the wrong metrics (like traffic without considering who those visitors are) can lead to poor results.
If you want more help tracking the success of your content marketing efforts, you can join the Copyblogger Academy. It’s a community of content marketers and you can collaborate with members or ask questions directly to the team that runs Copyblogger.
You’ll also have access to various marketing courses.
Alternatively, if you’d rather have your content marketing done for you, consider partnering with the Digital Commerce Partners and they can create and manage the content marketing strategy for you.
Source link: https://copyblogger.com/content-marketing-metrics/